Descriptive statistics and Basic probability
1. Introduction to statistics and its importance in engineering
Statistics is a collection of methods for planning experiments, obtaining data and then organizing, summarizing, presenting, analyzing, interpreting and drawing conclusions based on the data. It is applicable in the fields related to scientific, industrial, social and other engineering fields too. Probability and statistics are two related but separate academic disciplines. There are 2 main statistical methodologies are used in data analysis: descriptive statistics, which summarizes data from a sample using indexes such as the mean or standard deviation, and inferential statistics, which draws conclusions from data that are subject to random variation (e.g., observational errors, sampling variation).
Importance of statistics in various fields of engineering:
- Design of experiments uses statistical techniques to test and construct models of engineering components and systems.
- Quality control and process control use statistics as a tool to manage conformance to specifications of manufacturing processes and their products.
- Time and methods engineering use statistics to study repetitive operations in manufacturing in order to set standards and find optimum manufacturing processes.
- Reliability engineering uses statistics to measure the ability of a system to perform for is intended function and has tools for improving performance.
- Probabilistic design uses statistics in the use of probability in product and system design.
Despite these importance, statistics also has some limitations. It deals mostly with aggregations of quantitative data but not study individuals and concern the qualitative aspect. Statistics is liable to be misused. It neither proves nor disproves things and its use by inexperienced and untrained person might lead to fallacious conclusions.
2. Describing data with graphs ( bar, pie, line diagram, box plot)
As there is old saying “a picture worth a thousand picture”, huge data can be represented easily in figure. Diagrammatic and graphical representations are two ways of representing statistical data. Though graph and diagram may seem like same, they are different. Diagrams are constructed on plain paper which make use of various figures like : bars, rectangles, circles, cubes to compare data. But graphs are often plotted on graph paper and used mostly in studying mathematical relationship between two variables. Selection of scale, type of diagram is quite challenging and should be picked after researching the type of data available.
There are various types of diagrams used in statistics:
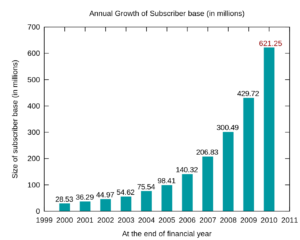
- Bar Diagram: It is a set of rectangles where the height of the bar is determined by the magnitude of data. The bars bases on same line and width is same for all. The magnitude of the bar is placed at the top of the bar.
- Pie Diagram (Pie Chart): It is circular diagram which is divided into numerous sectors by radial lines and each sector represent the value of specific component. The value is compared with 360 degree (total angle of circle) and the size of sector is determined. The angle covered by each sector is calculated by simple formula: 360*Given component value / Total component value. For example: If there are 30 males and 20 females in a group of 50 people. Then the sector of male is 360*30/50 = 216 degree in the circle.

- Box Plot: Box plot is a convenient way of graphically depicting groups of numerical data through their quartiles. In a group of ordered data, their median is identified first which divides the set into two half. If there are odd number of data, its cool but if the number is even, find average of the mid two numbers to get median value. Similarly, from the first and second half, find quartiles (first and third).
So, we have now values of Q1, Q2 and Q3. From these values, box plot is constructed. This video is sufficient to understand how to construct box plot.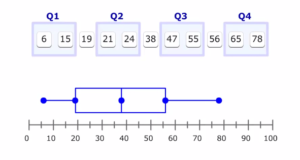
3. Describing data with numerical measure( Measuring center, Measuring variability)
There are two ways of describing data with numerical measure:
- Measure of central tendency: Central tendency is the middle point of a distribution i.e. measures of location or average. The main objective of central tendency is to facilitate the comparison between two or more groups. It helps in getting a single representative value from a population of sample. It helps in decision making and trace the mathematical and statistical relations. There are various measures of central tendency:
- Arithmetic Mean
- Geometric Mean
- Harmonic Mean
- Median
- Mode
- Measure of dispersion: There are cases where average is not sufficient to give clear picture of distribution as two distributions with same average may differ in the scatter-ness of the items from central value. So, measure of central tendency lacks to explain how other values of the data are spread from the average value. The major objective of measure of dispersion is to determine the reliability of average. It helps in identifying the causes of variability with a view to control it. It also assists in using other statistical tools. Following are the common measures of dispersion:
- Range
- Quartile deviation
- Mean deviation
- Standard deviation
4. Basic probability, additive Law, Multiplicative law, Baye’s theorem
- Addition Law:
If events A and B are mutually exclusive (disjoint), thenP(A or B) = P(A) + P(B)
Otherwise,
P(A or B) = P(A) + P(B) – P(A and B)
- Multiplicative Law:If events A and B are independent, then
P(A and B) = P(A)P(B)
Otherwise,
P(A and B) = P(A)P(B/A)